Did it fire?
See the advertising and analytics requests that followed each visitor action.
Browse your site normally. Pixel Inspector connects every click and form submission to the advertising and analytics requests that followed—then shows you the full payload in plain language.
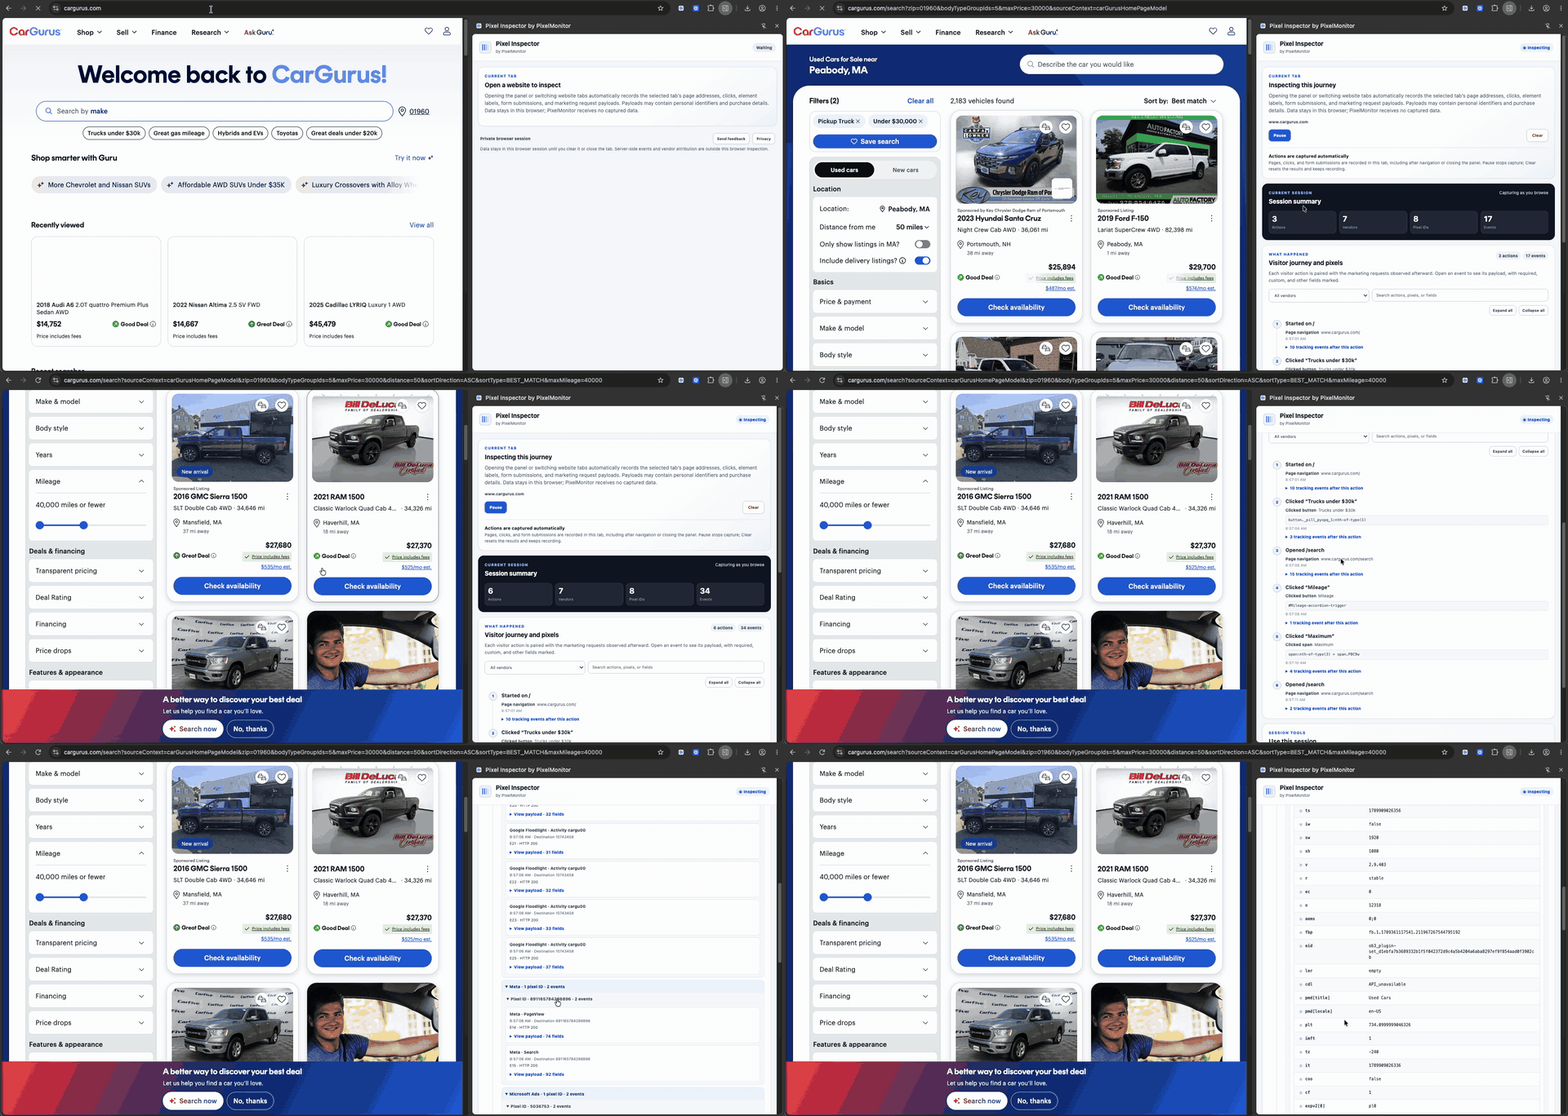
Answer the three questions that matter
See the advertising and analytics requests that followed each visitor action.
Find the vendor and destination ID without decoding a network log.
Read the complete captured payload, including site-specific fields and values.
How it works
There are no rules to configure and no expected events to define. Open the panel and use the website.
Pixel Inspector starts a private inspection session for the website tab you are viewing.
Visit pages, click buttons, and submit forms. Your actions become the timeline for the inspection.
Review the requests after each action, search every field, or export a report to share.
Built for marketers
Pixel Inspector turns browser requests into a record marketing, analytics, and engineering teams can read together.
Page visits, clicks, and form submissions appear with the marketing requests observed immediately afterward.
Events are organized by vendor and destination ID so duplicate or unexpected destinations stand out.
See field names and values in a marketer-friendly view, with the full captured payload still available.
Search actions, vendors, events, destination IDs, field names, and values from one place.
Export an HTML report for teammates or structured JSON for deeper analysis.
Inspection data stays in your Chrome session and is not uploaded to PixelMonitor.
Pixel Inspector shows browser-side requests and their delivery status. It does not claim to verify server-side events, attribution, or final receipt inside an ad platform.
Free Chrome extension
Install Pixel Inspector, open the side panel, and browse the site you want to inspect. Your first session takes less than a minute.

PixelMonitor learns the normal tracking behavior of a journey, checks it daily, and alerts your team when meaningful fields or events drift—without brittle rules for values that naturally change.